Excel Project Timeline Template with Milestones Guide
Clear project timelines transform scattered efforts into coordinated success. When milestones remain undefined, teams risk missed deadlines and budget overruns that derail entire initiatives. This guide walks through building an Excel project timeline template with defined objectives, sequenced tasks, resource assignments, and visual status indicators. Learn how to link dependencies, track progress, and adjust schedules quickly-so projects stay on target from start to finish.
Project Setup
Project Setup defines scope using a work breakdown structure before building the timeline. This foundation ensures every element aligns with overall goals from the start.
Scope statement captures what the project includes and excludes. It prevents scope creep while keeping the focus clear for everyone involved.
Stakeholder sign-off happens early in the process. The project manager and key participants review documents and confirm agreement within the first week.
Work breakdown structure breaks the project into manageable parts. Teams define three to five project phases and identify eight to twelve major deliverables as part of this step.
Define Objectives and Scope
Write three to five SMART objectives and a scope statement that lists in-scope and out-of-scope items. This step sets measurable targets before work on the timeline template begins.
Teams complete five specific tasks during this phase. They draft objective statements with measurable KPIs, create a scope document with three exclusions, and hold a forty-five minute stakeholder workshop.
Document assumptions and constraints in a shared file. The team then obtains written sign-off before any timeline work starts in the excel project timeline template.
Objectives guide every decision from this point forward. Clear scope boundaries support accurate milestone placement and realistic duration estimates across the project phases.
Timeline Structure
Timeline Structure sets fixed start and end dates plus total duration for the entire project. This framework helps teams organize work into manageable segments while maintaining visibility across all phases.
Locking calendar dates prevents accidental changes that could disrupt the overall flow. Project managers can protect these cells with spreadsheet permissions to maintain schedule integrity.
Calculating working days requires excluding weekends and holidays from the total count. An excel project schedule template stores these dates in dedicated cells for easy reference and updates.
Building buffers accounts for unexpected delays or scope changes during execution. A 14-week project with 68 working days and a 10 percent contingency buffer provides flexibility without extending the final deadline.
Start and End Dates
Set project start date as Monday, March 4, 2024 and end date as Friday, June 14, 2024 for a 14-week timeline. These dates establish the outer boundaries that all tasks must fit within.
Enter March 4 start date and June 14 end date in cells B2 and B3 of the excel timeline template. This placement keeps the information visible and accessible for all project stakeholders.
Use NETWORKDAYS function to calculate 68 working days between these two dates. The formula automatically skips weekends and any specified holidays entered in a separate reference range.
Add 7-day buffer at the end for schedule baseline adjustments. This extra time allows teams to handle minor delays without affecting the final delivery commitment to stakeholders.
Lock dates with data validation dropdowns so team members cannot change them without project manager approval. This control maintains version consistency across the entire project timeline document.
Task Breakdown
Task Breakdown converts deliverables into 25-35 granular tasks using a work breakdown structure. This process creates a clear foundation for your excel project timeline template with milestones. Each task receives a unique identifier and connects to specific timeline elements.
Break down the work scope by listing every required action in sequence. Assign task owners to each item and estimate the hours needed. The template typically includes columns for task ID, task name, duration, and responsible party to track progress efficiently.
Review the task list against the project scope to catch missing items early. This step helps prevent timeline gaps and supports accurate resource allocation across all project phases.
Keep the breakdown focused on actionable steps that move the project forward. Update the task timeline as new details emerge during execution. This approach keeps your excel timeline organized and easy to follow.
Identify Deliverables
Identify 8 deliverables: requirements document, UI mockups, backend API, test plan, user manual, training video, deployment package, and final report. Each deliverable connects to specific owners and hour estimates that feed into your project schedule template.
The requirements document belongs to Sarah Chen with 24 hours allocated. UI mockups fall to Mike Torres at 32 hours while the backend API requires 120 hours from the Dev Team. These assignments appear clearly in your excel project tracker.
Additional deliverables include the test plan at 16 hours for the QA Lead, user manual at 20 hours for the Tech Writer, and training video at 12 hours from L and D. The deployment package needs 8 hours from DevOps while the final report takes 6 hours from the Project Manager.
These eight items total 238 hours across the entire project timeline. List each deliverable with its owner and estimated hours in your milestone gantt to maintain visibility. This structure supports accurate scheduling and resource planning throughout execution.
Milestone Planning
Milestone Planning marks 6-8 key achievement points that signal phase completion. These points help project managers track progress without getting lost in daily task details. Each milestone represents a major deliverable or decision point in your project timeline.
Selecting milestone dates requires careful alignment with your overall project schedule. Choose dates that reflect realistic completion points based on available resources and dependencies. Avoid setting milestones too close together or too far apart.
Linking milestones to deliverables creates clear accountability. Each milestone should connect directly to specific outputs like signed documents, approved designs, or completed testing phases. This connection makes progress visible to all stakeholders.
Using milestone markers in the Gantt chart provides visual clarity. These markers appear as diamonds or flags on your timeline template. Set milestone completion percentage to 0% or 100% only to maintain accurate tracking of true completion status.
Key Achievement Points
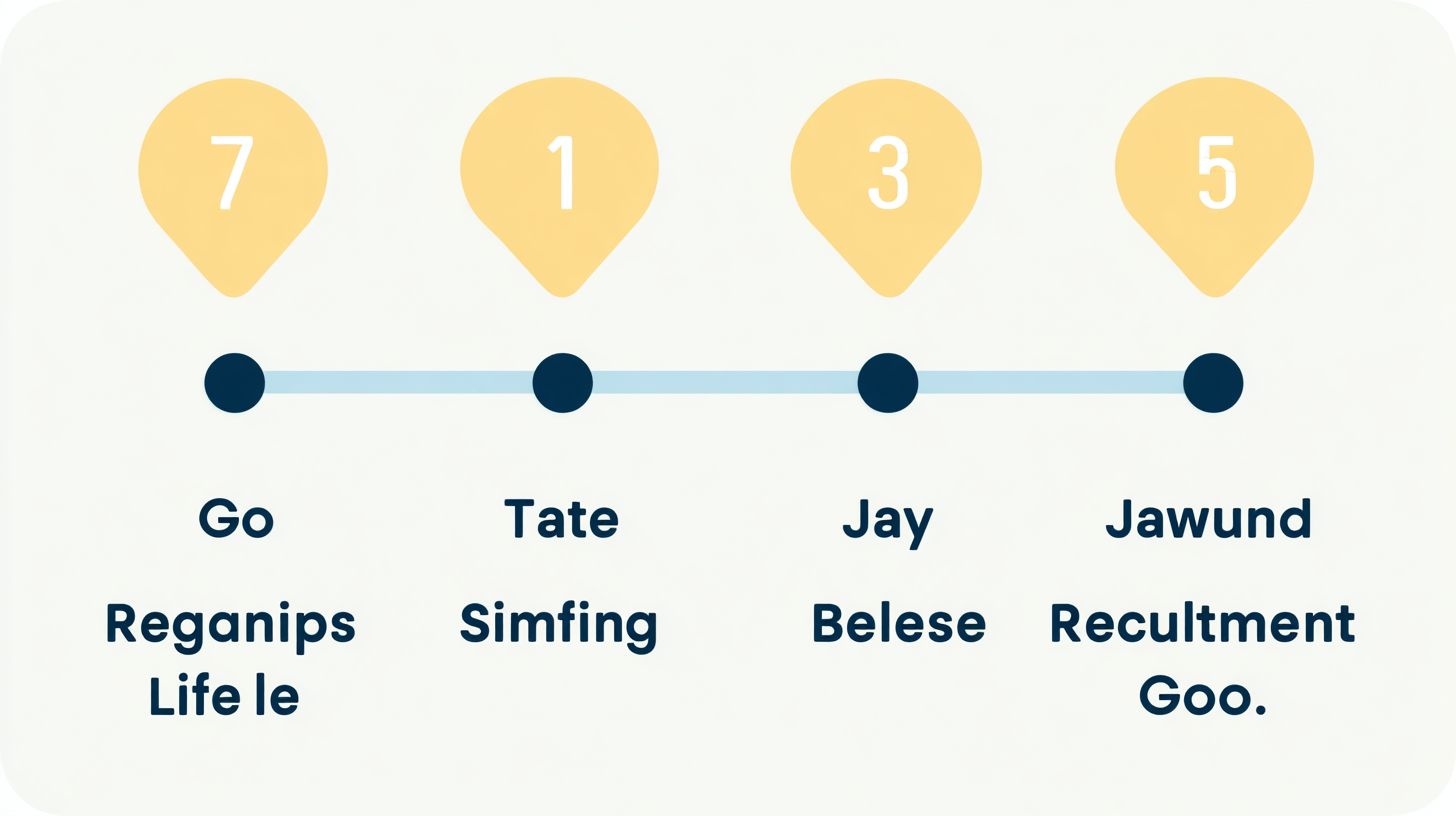
Define 7 milestones: Requirements Sign-off (Week 2), Design Approval (Week 4), Alpha Release (Week 7), Beta Release (Week 10), UAT Complete (Week 12), Go-Live (Week 13), Project Closure (Week 14). These dates create a structured project roadmap that guides your entire timeline.
| Milestone Name | Target Date | Actual Date | Status | Owner | Days Variance |
|---|---|---|---|---|---|
| Requirements Sign-off | Week 2 | ||||
| Design Approval | Week 4 | ||||
| Alpha Release | Week 7 | ||||
| Beta Release | Week 10 | ||||
| UAT Complete | Week 12 | ||||
| Go-Live | Week 13 | ||||
| Project Closure | Week 14 |
This milestone tracker table helps monitor progress across all project phases. Add columns for Target Date, Actual Date, Status, and Owner to capture essential details. The Days Variance column automatically calculates differences between planned and actual completion.
Apply conditional formatting rules to highlight status changes. Set cells to turn green when status reaches 100% completion. Configure red highlighting when actual date exceeds target by more than three days.
Use a formula in the Days Variance column to calculate differences automatically. This formula subtracts target dates from actual dates and displays the result. The calculation updates whenever you change date entries in your excel timeline.
Dependencies and Sequencing
Map 12 task dependencies and identify the critical path using the Excel Gantt chart template. The project timeline template becomes more accurate when you connect tasks properly through task dependencies. This approach helps project managers prevent delays and maintain a realistic schedule.
Five main dependency types guide how tasks relate to each other in the Excel project timeline. Finish-to-Start requires one task to complete before another begins. Start-to-Start allows two tasks to begin simultaneously. Finish-to-Finish means two tasks must conclude at the same time. Resource dependency occurs when team members cannot handle multiple tasks at once. External dependency involves outside factors like vendor deliverables.
Real examples show these dependencies in action within a project schedule template. Backend API development must finish before Test Execution starts. UI Design and Requirements Review can begin together on the same day. User Manual writing and Training Video production must both finish together. The Dev Team cannot work on two parallel sprints due to resource limits. Third-party API documentation must arrive by March 18 as an external deadline.
Enter predecessors in column H of the Excel timeline spreadsheet to link related tasks. Type the row number of the preceding task in that column for each dependent activity. The =CPATH() add-in then calculates the critical path automatically across all connected tasks. This calculation highlights which sequence of activities determines the overall project completion date.
Resource Allocation
Allocate 6 team members across 238 total hours using the resource allocation matrix in the Excel project tracker. This approach helps balance workloads across each phase of the project timeline. Proper planning prevents delays when multiple tasks overlap in the schedule.
The resource histogram displays weekly capacity limits for every role. Sarah Chen works as a business analyst with a maximum of 24 hours per week. Mike Torres has 32 hours available as the designer. Each developer on the team can contribute up to 40 hours weekly while the QA lead stays at 16 hours.
Additional capacity comes from the technical writer at 20 hours per week and DevOps at 8 hours weekly. These limits appear in dedicated columns beside each team member name. The spreadsheet template uses these values to calculate remaining availability for new assignments.
Apply the SUMIF function to check total assigned hours against weekly limits. The formula sums hours for each person across all tasks. When the total exceeds 40 hours, conditional formatting turns the cell red to signal an overallocation.
A RACI matrix clarifies responsibilities for the Alpha Release milestone. This chart shows who handles each activity and who needs updates at key points.
| Task | Sarah Chen (BA) | Mike Torres (Designer) | Dev Team | QA Lead | Tech Writer | DevOps |
|---|---|---|---|---|---|---|
| Requirements sign-off | Responsible | Consulted | Informed | Consulted | Informed | Informed |
| Final design review | Accountable | Responsible | Consulted | Informed | Consulted | Informed |
| Code deployment | Informed | Informed | Responsible | Consulted | Informed | Accountable |
| Testing completion | Consulted | Consulted | Consulted | Responsible | Informed | Consulted |
| Documentation update | Informed | Consulted | Informed | Informed | Responsible | Informed |
Fill the matrix directly in the Excel project tracker beside the milestone dates. Update assignments when task ownership changes during the project schedule.
Progress Tracking
First sentence: Progress Tracking updates task status and completion percentages weekly via a shared project dashboard. A consistent review cycle keeps the project timeline accurate and current for all team members. Regular updates prevent surprises and maintain alignment with the overall project plan.
Establish a weekly update cadence by requiring all task owners to refresh their status every Friday by 3pm. This fixed deadline creates accountability and ensures the project dashboard shows the latest information before weekend planning begins. Stakeholders can then review accurate data on Monday morning.
Use traffic light status indicators to quickly communicate task health across the excel timeline. These visual cues allow the project manager to spot issues without reading every row. The system works well with both gantt chart views and simple task lists.
Roll up completion percentages to the milestone level by averaging task progress within each phase. This approach gives stakeholders a clear view of milestone progress without overwhelming detail. Store all historical snapshots in a separate tab to track changes over time and support schedule baseline comparisons.
Status Indicators
First sentence: Implement 4 status indicators: Not Started (0%), In Progress (amber, 1-99%), Completed (green, 100%), At Risk (red, overdue by 2+ days). Create a data validation dropdown in the status column with these four options to standardize entries across the team. This prevents inconsistent wording and simplifies filtering in the excel template.
Add conditional formatting rules that apply green fill when completion reaches 100 percent, amber for 50 to 99 percent, and red when a task becomes overdue. These automatic colors highlight the status column without manual effort each week. The visual system integrates smoothly with project tracking workflows.
Build a progress bar using the REPT function formula to display completion visually beside each task. The formula creates filled blocks for completed work and empty blocks for remaining effort. This progress bar appears directly in the milestone tracker for quick scanning.
Display a weekly status update summary on the dashboard that shows overall completion as of the current week. The summary pulls data from the main task list and milestone chart automatically. This gives the project manager and stakeholders an at-a-glance view of the project schedule without opening multiple sheets.
Visual Formatting
Apply visual formatting using the Excel Gantt chart template with color-coded bars and milestone markers. This approach transforms a basic task list into a clear project timeline that stakeholders can review at a glance.
The first step involves applying the =AND formula across weeks 1 through 14 to generate Gantt bars automatically. Each formula checks the start date and end date for every task, then fills cells only when the current week falls within the task duration.
Color coding distinguishes project phases throughout the timeline template. Planning tasks receive blue bars, development work displays in green, testing phases appear in orange, and deployment activities show in purple. This system helps project managers identify which phase is active without scanning individual rows.
Diamond symbols mark key milestones at row height 18 using the character. These milestone markers sit at the center of each deadline week and stand out against the colored progress bars below them.
Thin vertical borders create clean week boundaries across the entire schedule template. These lines separate each week column while maintaining readability when the chart spans multiple months of project work.
Freezing panes at column F keeps task names, start dates, and end dates visible while scrolling through later weeks. This setup supports project tracking when reviewing extended timelines with stakeholders.
A 60 percent zoom level creates an executive dashboard view of the full project schedule. The reduced scale displays the complete milestone timeline on a single screen for quick status updates during meetings.
Before formatting, the spreadsheet shows only dates and task descriptions in standard columns. After applying the Gantt chart template, colored bars stretch across weeks, diamond markers highlight deadlines, and the frozen header area remains visible during navigation.
Review and Adjustments
Conduct bi-weekly reviews comparing actual progress against the schedule baseline and adjust the timeline Gantt. These regular check-ins help teams spot delays early and keep the project timeline aligned with original goals. The project manager leads each session using the excel project timeline template as the reference point.
Four review checkpoints provide structure throughout the project lifecycle. Week 4 marks design complete, Week 7 covers alpha delivery, Week 10 reviews beta status, and Week 13 confirms go-live readiness. At each checkpoint, teams calculate schedule variance using the formula =ActualFinish-TargetFinish to measure any deviation from the planned project schedule.
Teams document every adjustment in a dedicated change log tab. This log includes columns for Change ID, Date, Description, Impact measured in days, and Approved By. The change log creates a clear audit trail for all modifications made to the project timeline.
Total variance stays limited to plus or minus five days across the entire project. Larger shifts require a formal change request and stakeholder re-approval before implementation proceeds. This rule protects the schedule baseline and prevents scope creep from derailing the project plan.
| Change ID | Date | Description | Impact (days) | Approved By |
|---|---|---|---|---|
| CH-001 | April 22 | Task 3.2 development extended due to additional testing requirements | +3 | Project Manager |
| CH-002 | April 22 | Resource reallocation for design review phase | +3 | Project Manager |
| CH-003 | April 22 | Stakeholder feedback incorporated into milestone deliverables | +3 | Project Manager |
Frequently Asked Questions
What is an excel project timeline template with milestones?
An excel project timeline template with milestones is a ready-to-use spreadsheet that helps you map out your project schedule, key deliverables, and critical checkpoints all in one place using Microsoft Excel.
How do I customize an excel project timeline template with milestones?
You can customize the excel project timeline template with milestones by editing task names, adjusting dates, changing colors, and adding or removing milestone markers to suit your specific project needs.
Why should I use an excel project timeline template with milestones?
Using an excel project timeline template with milestones keeps your team aligned, highlights important deadlines, and makes it easy to track progress without needing specialized software.
Can I share an excel project timeline template with milestones with my team?
Yes, an excel project timeline template with milestones can be shared via email, cloud storage, or collaboration platforms so everyone stays updated on tasks and milestone dates.
What features should I look for in an excel project timeline template with milestones?
Look for built-in Gantt-style views, conditional formatting, milestone symbols, and auto-updating date formulas when choosing an excel project timeline template with milestones.
Where can I download a free excel project timeline template with milestones?
You can download a free excel project timeline template with milestones from reputable template sites, Microsoft’s template gallery, or productivity blogs that offer downloadable Excel files.